I built a toolbar to understand Laravel Requests
I wanted to see where a Laravel request spent its time. That curiosity became a Vue-powered toolbar, with PHP collectors and Shadow DOM isolation.
Laravel Toolbar did not start because I thought Laravel needed another debug bar. It started because I wanted to understand one request.
I knew the broad outline: Laravel boots, registers and boots service providers, finds a route, runs middleware, calls a controller, renders a view and prepares a response. What I could not see was how those pieces related inside an application I was actually building. If a request took 80 milliseconds, I wanted something more useful than one total. I wanted to know which part deserved my attention.
An older fork and a better question
The public trail starts on 9 October 2025, when I returned to an older fork of a Telescope toolbar. It already had Inertia and Vue support, and I had added the Vue DevTools inspector. Clicking a component in the inspector could take me straight to its source. That small interaction made the toolbar feel less like a row of statistics and more like a way into the application.
I had also tried changing existing toolbars and kept running into the same problem. Their PHP data was useful, but their frontends were difficult for me to extend. They were not built with a framework I wanted to work in, so ordinary interface changes felt much harder than they should. I wanted the toolbar itself to be a real Vue application.
The first proof of concept still got its data from Telescope. I was not trying to replace every profiler or invent a package at that point. I was curious whether I could combine that data with a frontend I enjoyed maintaining. A week later I shared an Apple- and Nightwatch-inspired design. Nightwatch had shown me that development tooling could feel like a considered product rather than a panel you tolerated because the information was useful.
Build log · Oct–Nov 2025
From fork to profiler
A revived fork
The first public demo: a Telescope toolbar with Inertia, Vue and Vue DevTools support.
 02
02The panels take shape
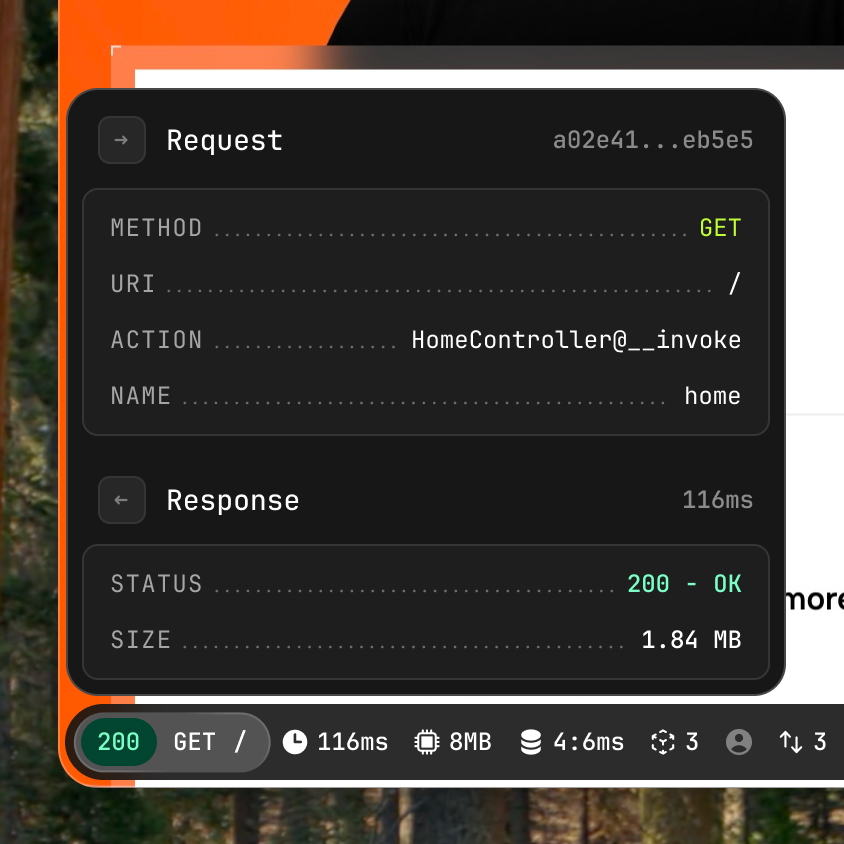
Request and response data moved from the bottom bar into a panel designed as part of the Vue interface.
 03
03One request, stage by stage
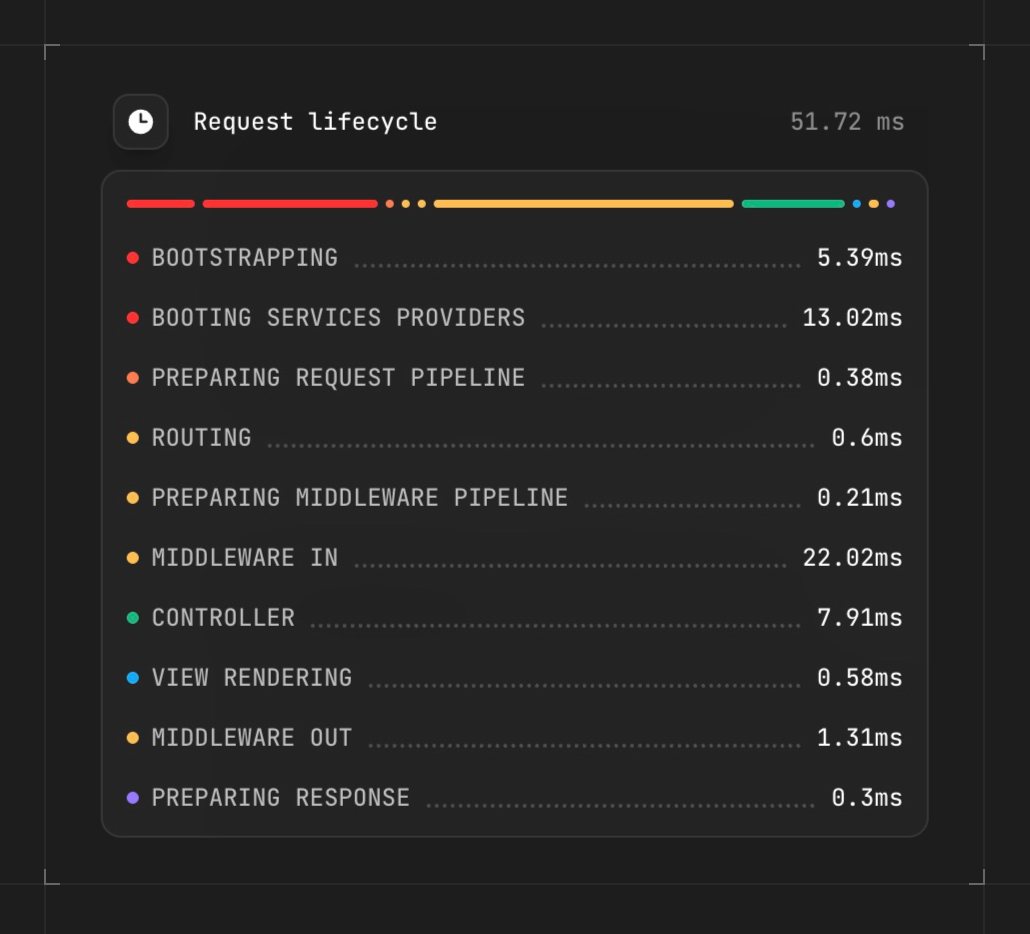
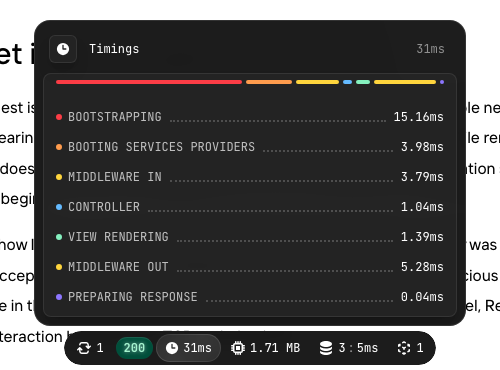
The profiler finally accounted for the request lifecycle from bootstrapping through response preparation.
 04
04An isolated frontend
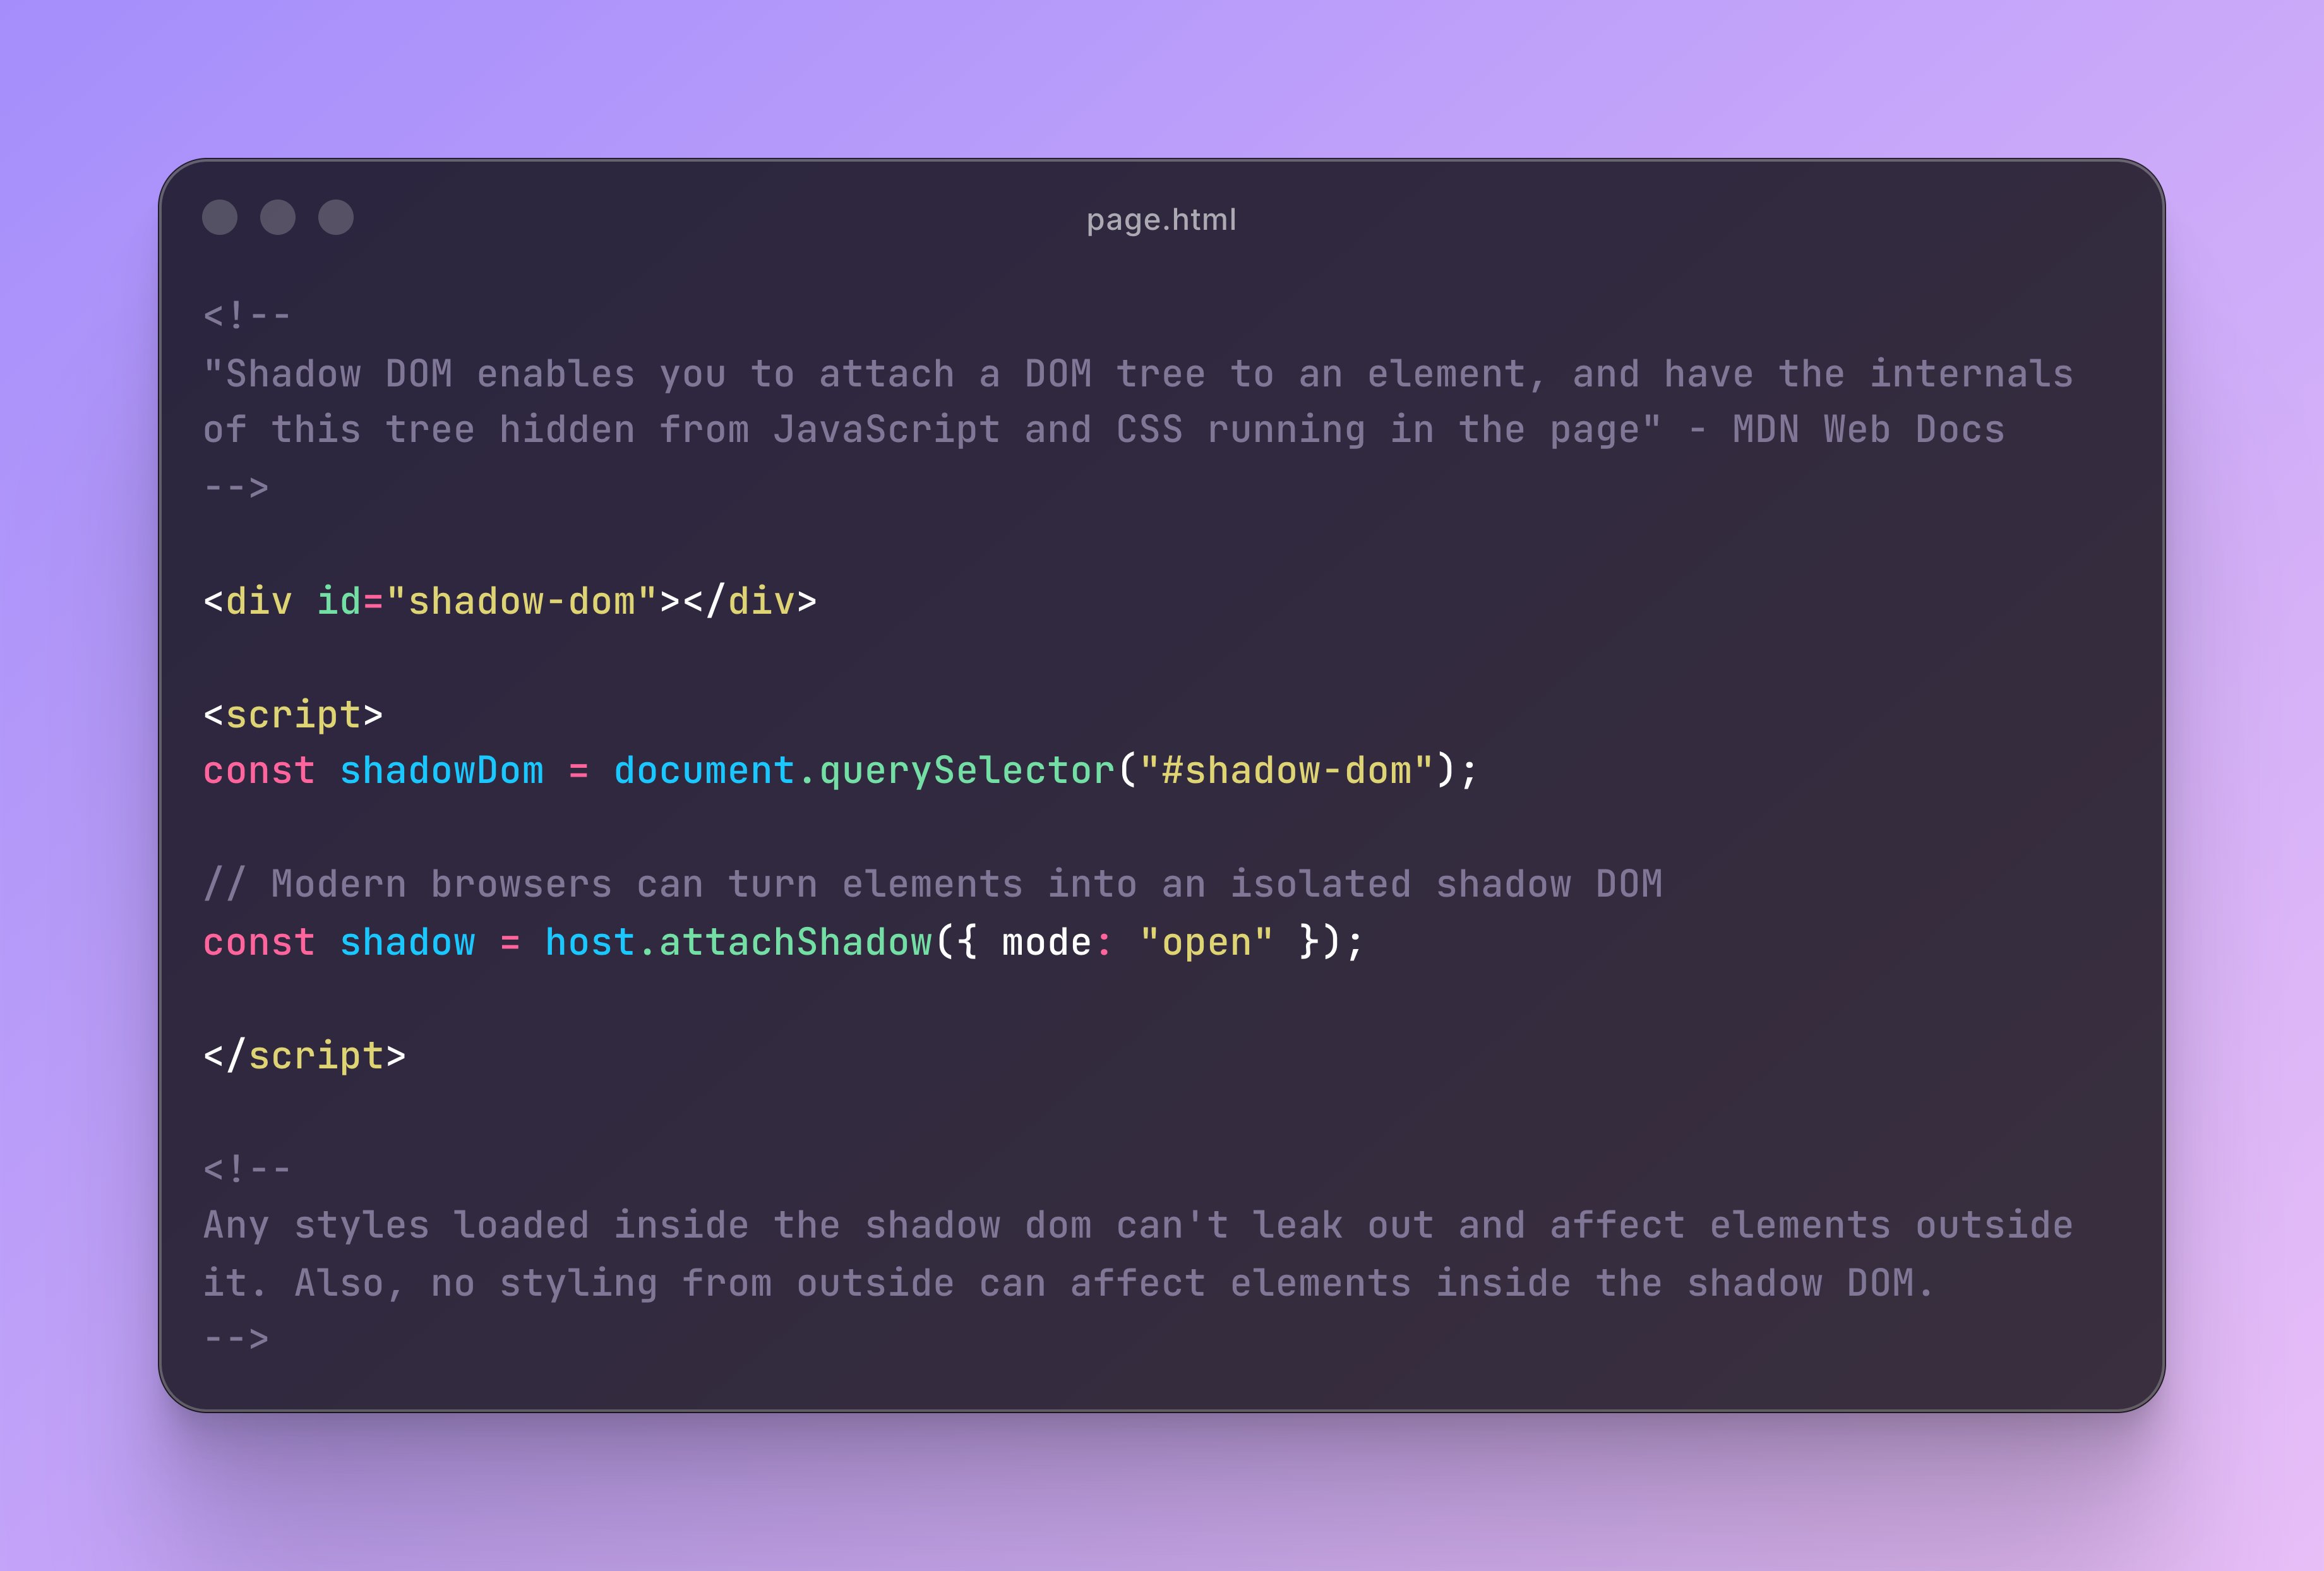
Shadow DOM kept the host application and the toolbar from rewriting each other's styles.
Measuring a request without lying
Drawing a bar is easy. Deciding what every part of that bar honestly represents is much harder.
A lifecycle stage cannot begin after the work it is supposed to measure, and it cannot end after the next stage has already started. Laravel exposes many useful events, but they do not arrive as a ready-made timeline. I had to find the right boundaries, record checkpoints and then make sure all the durations accounted for the request instead of leaving unexplained time between them.
On 13 November I showed an interactive timeline with stages for booting, routing, middleware, the controller and response preparation. Four days later I had built the request profiler from scratch. The difficult part was identifying the exact start and end of each stage. Once the numbers added up correctly, the toolbar had found its reason to exist.
The profiler was not meant to replace a call-level tool such as SPX. It gave me a map of the framework request: bootstrapping, service providers, request and middleware pipelines, routing, middleware in, the controller, view rendering, middleware out and response preparation. That was enough to turn a vague delay into a smaller question.
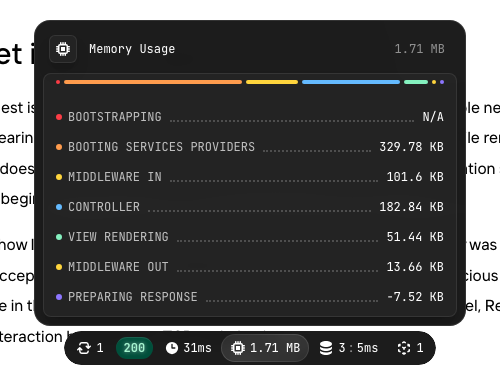
I added memory changes to the same stages, with an important limitation. The number beside a stage is the difference between its beginning and end, not its peak memory usage. Memory can increase and be released during the stage, so those deltas do not add up to the request peak. They were still consistent enough to help point at bottlenecks. A controller with high database time and little memory growth suggests a different investigation from one doing expensive in-memory work.
There were also edges I could not measure cleanly from a package. The earliest bootstrapping begins before the package can observe it; measuring all of it would require changing the application's index.php. Learning where not to claim precision was part of learning the lifecycle.
Keeping PHP and Vue on opposite sides
The architecture became simpler once I stopped asking the frontend to know how anything had been collected. PHP listens to the application, measures the lifecycle and runs the enabled collectors. Vue receives the result and decides how to present it.
For a normal HTML response, the package serializes the collected data and injects it with the toolbar host before the closing body tag. The hand-off is visible in one line: window.__LARAVEL_TOOLBAR_DATA__ = {...}. Inertia navigations carry toolbar data in a response header instead. The transport changes, but the boundary stays the same: PHP produces data; Vue renders it.
That separation gave me the maintainable frontend I had wanted from the beginning. Panels could be ordinary Vue components. The data could be typed in TypeScript. Vite could provide hot module replacement while I developed the package. When I worked on configuration, I chose provider objects and DTOs partly because those types could be transformed from PHP into TypeScript instead of being recreated by hand.
The prototype started with Telescope, but the package eventually moved most collection into its own Laravel events and observers. Telescope is optional in the package today. It was the useful starting point, not the boundary of what the toolbar could become.
The host application kept fighting back
A toolbar has an awkward home. It is injected into an application it does not control, often an application that already uses Tailwind. Loading the toolbar's Tailwind output normally caused styles in the host application to reset. Scoping the toolbar CSS stopped that reset, but element styles from the host could still leak back in and change tables, cells and other ordinary elements inside the toolbar.
Tailwind prefixes were another option, but they would have changed every class in every Vue component and added scripts to maintain that convention. It solved the collision by making the frontend worse to work on.
Then AI suggested Shadow DOM. I could inject one host element into the page, attach an open Shadow Root and mount Vue inside it. Normal CSS selectors on either side do not cross that boundary. The host application stopped rewriting the toolbar, and the toolbar stopped rewriting the host.
I documented the failed approaches and the result in a five-post Shadow DOM thread. Shadow DOM introduced some extra work: styles had to be loaded into the root, Vue had to mount there, and hot reloading and cached markup had to respect the boundary. But that complexity stayed near the mounting code. Everywhere else I could use normal Vue components and ordinary Tailwind classes. That was the breakthrough that made the frontend feel sustainable.
When the experiment became a package
By 20 November I was writing about preparing an initial release. The toolbar had its own profiler, collectors, frontend architecture and configuration model. Tools could be placed in left, centre or right sections, grouped and reordered from PHP, while the corresponding Vue structure became simpler.
The repository dates from November 2025, and the first tagged release followed in January. Its summary described the same core that had emerged in the public build log: request profiling, query and memory monitoring, a Vue 3 interface and an isolated Shadow DOM.
That progression matters to me because the package was not the original goal. The goal was to understand what Laravel was doing. The package appeared when the thing I built to answer that question became useful enough to keep.
What the toolbar shows today
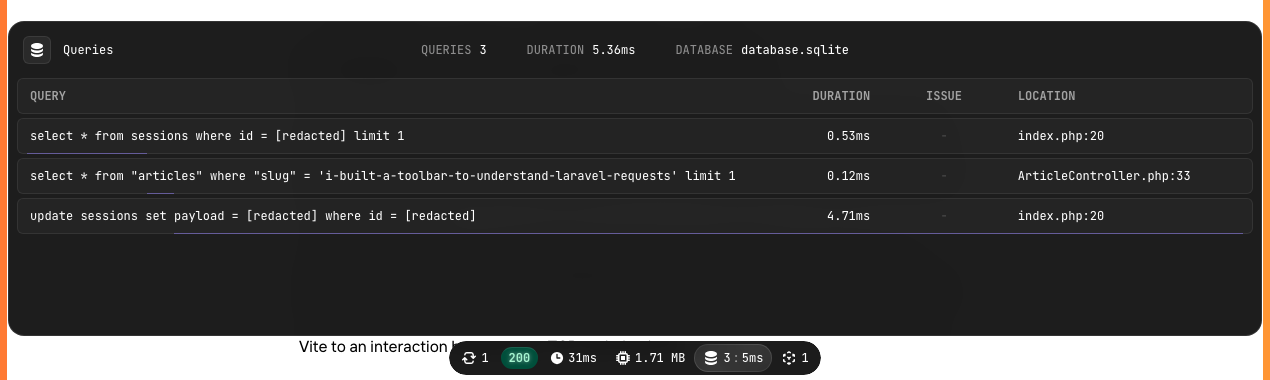
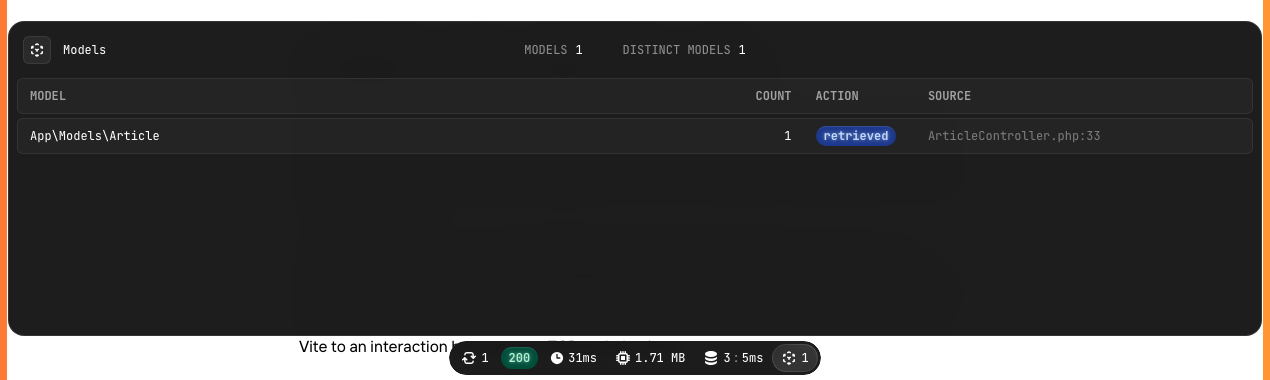
The toolbar kept moving after its first release. On this site, hovering over a number in the bar opens the tool behind it. The request tool now splits the panel in two: the incoming request on the left and the response on the right. Alongside it are request history, lifecycle timings, memory changes, database queries and model activity.
Current toolset
Six views into one request
 01 / 6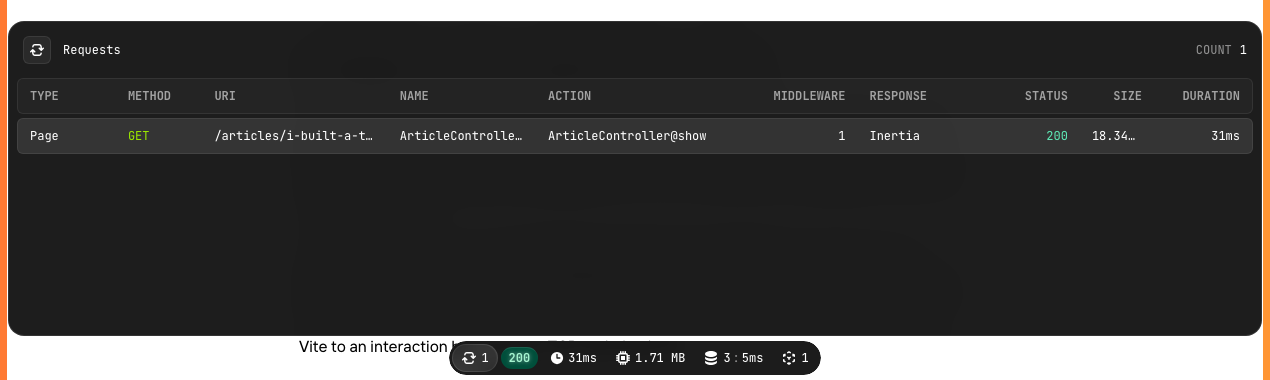
Request & response
Incoming request details and the outgoing response now sit side by side, with their own summaries, middleware, data, headers and cookies.
Together they turn the bar from a summary into a set of ways into the request. I can start with the lifecycle, then move towards the query, model or response that made one segment worth investigating.
A target is more useful than a total
Once a request is divided into visible stages, each segment becomes a possible next step. Is time disappearing while providers boot? In a query? Inside the controller? While rendering? The toolbar does not optimize the application for me, but it gives the investigation somewhere concrete to begin.
That is also how I later noticed 40 milliseconds hiding in Inertia SSR. The delay was small enough to accept as development overhead, but stable enough to look suspicious once it had its own place in the request. Following that segment eventually led past Laravel, React and Vite to an interaction between two TCP optimisations.
Laravel Toolbar exists because I kept following one question: where did this request spend its time? The most useful thing it can do is make the next question difficult to ignore.